Comparisons: Droop Quota ~ Proportionality 3
Comparison between the Droop Quota and CHPV Voting System LSIs
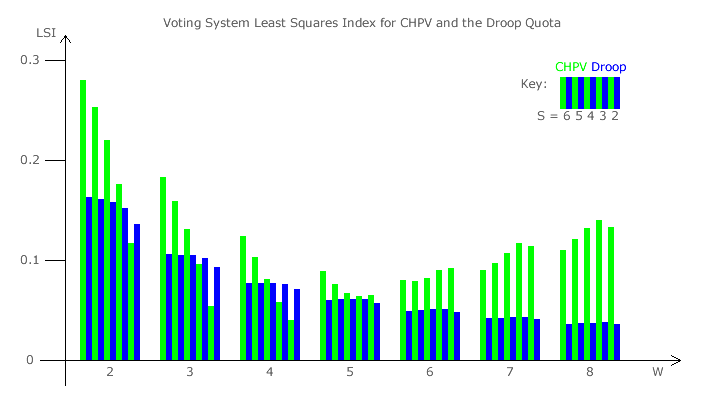
The preceding bar chart for the Droop Quota can now be compared directly to the corresponding one for CHPV; see the relevant Evaluations: Proportionality of CHPV page. The bar chart below displays the various LSIVS for CHPV and the Droop Quota side-by-side. For each corresponding pair, the left bar for CHPV is highlighted in green and the right bar for the Droop Quota is coloured blue.

It is clear from this comparison that the Droop Quota is generally more proportional than CHPV. There are in fact only five exceptions; namely when there are two parties competing for two, three or four seats and when there are three parties contesting either three or four seats. With five seats, the Droop Quota is only marginally more proportional than CHPV regardless of the number of competing parties.
Party Proportionality of the Droop Quota and CHPV
Party-list CHPV can now be compared to the Droop Quota in terms of both disproportionality and optimality (see earlier section). For the Droop Quota, the proportion of all possible outcomes that generate an optimally proportional election result (optimality) declines with each extra seat added. Yet minimising the discrepancies between tally and seat shares (proportionality) for the Droop Quota improves with each extra seat added. Where a large number of winners is required, a Droop Quota party-list election can be held in either one constituency (for maximum proportionality) or across numerous smaller ones (for a geographically distributed representation).
In contrast, for CHPV, both optimality and proportionality peak around a narrow range of a few winners. It is for this reason that party-list CHPV is only conducted concurrently across multiple few-winner constituencies. For six or more winners, CHPV does not outperform the Droop Quota on either measure.
However, for up to five winners, the optimality of CHPV either betters that for the Droop Quota (for W = 3 and W = 4) or is comparable with it (for W = 2 and W = 5); at least for two or three parties. As observed above, the proportionality of CHPV either exceeds that of the Droop Quota or is comparable with it for two or three parties competing for up to five seats. This proportionality performance therefore closely matches that for optimality. However, for more competing parties, the disproportionality index increasingly favours the Droop Quota even for such few winners.
In conclusion, CHPV only outperforms the Droop Quota in terms of party proportionality where two or three parties compete for either three or four seats. However, where these parties compete for two or five seats, the performance of the two systems is similar. Therefore, for elections with few winners and few parties, these two voting systems are comparable methods.
Proceed to next section > Comparisons: Party-List ~ D'Hondt
Return to previous page > Comparisons: Droop Quota ~ Proportionality 2
