Comparisons: Party-List 3
Largest Remainder versus Highest Averages Methods
Party-list CHPV is a highest averages method. If this method is inherently superior to largest remainder ones, then why would a largest remainder one ever be used? Or if inherently inferior, why would a highest averages approach ever be employed? In fact, there is a trade-off to be had here between proportionality and monotonicity.
All party-list methods are designed to closely match the share of the seats for each party to its share of the vote. Some rounding is inevitable given that proportional seat shares are invariably fractional ones. If a party is to be awarded 6.43 seats on a proportional basis, then in practice it should preferably be given either 6 or 7 seats after rounding down or up respectively.
Where a method always rounds seats up or down to the nearest integer, this method satisfies the quota rule. More specifically, the quota rule is satisfied where each party is awarded either X or Y seats (where Y = X + 1 and X is an integer) when it is due a proportional but fractional number of seats between X and Y. All largest remainder methods employ a quota and are inherently designed to comply with this rule.

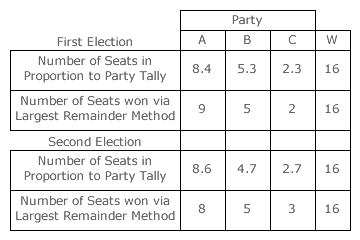
Unfortunately, this largest remainder approach is however non-monotonic and it can hence generate some paradoxes. As an example, consider two consecutive party-list elections with three parties A, B and C (S = 3) competing to fill sixteen vacant seats (W = 16); see table opposite. In the first election, there is only one seat remaining to be filled after the quotas have been reached. With a largest remainder of 0.4, this final seat is awarded to party A. In the second election, two seats remain after allocation by quota and parties B and C each gain one as they have the two largest remainders (0.7).
Note the paradox that occurs here. Party A improves its vote share as its exact proportion of seats rises from 8.4 to 8.6; an increase of 0.2 seat. However, it receives one seat less from the election algorithm! This is one of many paradoxes that can occur even in this simple three-party sixteen-winner scenario. When using the largest remainder method in multiple-party multiple-winner party-list elections, such non-monotonic one-seat paradoxes are not uncommon.
In contrast, the highest averages methods are inherently monotonic and do not exhibit such paradoxes. Where a party receives an increase in its vote share, its tally therefore rises and each of its candidate averages rise in direct proportion to it. These higher averages may or may not result in gaining one or more extra seats but it is impossible to lose a seat when an average is increased.
However, in avoiding paradoxes, highest averages methods consequently fail to satisfy the quota rule. For example, a party with 23.9 seats in proportion to its vote may actually receive 25 seats from the election algorithm. To comply with the quota rule, either 23 or 24 seats should have been awarded. The seat discrepancy of (25 - 23.9) x 100% or 4.4% is relatively small here. As the number of seats rises, the worst-case discrepancy must shrink as a percentage if the quota rule is obeyed. Therefore, as this rounding margin shrinks, the chances that the quota rule is not complied with only increase.
In choosing between the adoption of a largest remainder method or a highest averages one for a party-list election, the trade-off is clear. If the quota rule is paramount and one-seat paradoxes can be tolerated, then a largest remainder method is appropriate. Conversely, if paradoxes are unacceptable and minor violations to the quota rule can be tolerated, then a highest remainder method should be chosen.
Proceed to next section > Comparisons: Party-List ~ Hare Quota
Return to previous page > Comparisons: Party-List 2
